


looker studio is a reporting and visualization tool that turns connected marketing data into interactive dashboards. For an SEO team, that usually means bringing together information from Google Search Console, Google Analytics, Google Ads, spreadsheets, or other approved connectors, then presenting it through charts, tables, scorecards, filters, and written context. It is not an SEO auditing tool by itself, and it does not improve rankings simply because a dashboard exists. Its value is more practical: it helps a business see what changed, investigate why it changed, and decide what to do next.
That distinction matters to small businesses, e-commerce teams, international companies, and agencies. A dashboard can make a ranking loss visible, but it cannot tell you whether the cause was a migration, indexation problem, seasonality, weaker content, a demand shift, or a reporting error unless the underlying data and analysis are sound. The best reports therefore combine trusted source data, clear metric definitions, and decisions attached to trends.
What Looker Studio is—and what it is not
A Looker Studio report is a visual interface built on top of one or more data sources. A data source defines where information comes from and how fields are interpreted. The report then uses those fields in components such as scorecards, time-series charts, tables, filters, and controls. Google’s documentation distinguishes reports from data sources and describes data sources as the layer that connects and configures data for reporting; the current documentation is the appropriate reference when checking setup behavior in 2026 (Google’s Looker Studio overview).
For SEO consulting, the simplest useful model has three layers:
- Source layer: Search Console, Analytics, advertising platforms, a product feed, a CRM export, or a spreadsheet.
- Model layer: field names, calculated fields, filters, date settings, channel definitions, and any blending rules.
- Decision layer: charts and commentary that answer a business question, such as “Which non-brand pages lost qualified organic traffic after the template change?”
Search Console and Analytics answer different questions. Search Console is concerned with how a site appears and performs in Google Search, while Analytics is concerned with what users do after arriving on the site. Google describes Search Console’s Performance report through dimensions such as queries, pages, countries, and devices, with metrics including clicks, impressions, click-through rate, and average position (Google Search Console Performance report documentation). Analytics can add engagement, conversions, revenue, and other on-site outcomes, but those measures should not be treated as substitutes for Search Console metrics.
That separation prevents a common reporting mistake: calling every visit an SEO result. A Search Console click is not the same thing as an Analytics session, and neither is automatically a sale. A useful report keeps the measurement chain visible:
- Visibility: Did eligible pages receive impressions?
- Search response: Did searchers click those pages?
- On-site behavior: Did users engage with the site?
- Commercial outcome: Did qualified users submit, subscribe, call, or purchase?
Looker Studio is therefore best understood as a decision-support layer, not a universal source of truth. If a connector is misconfigured, a date range is inconsistent, or two sources use different attribution rules, a polished dashboard can make bad analysis look authoritative.
Why it matters for SEO and commercial reporting
SEO performance is rarely explained by one number. A monthly organic traffic total can rise because of branded demand, a temporary news event, or one high-volume page while important commercial pages decline. A ranking average can improve while clicks fall if the query mix changes. A dashboard earns its place when it exposes those differences without forcing a business owner to inspect several exports manually.
For an e-commerce brand, the useful question is not simply “Did organic sessions increase?” It might be “Which category templates gained non-brand clicks and revenue, and which products received impressions without attracting visits?” For a local business, it could be “Are location pages generating calls and direction requests, or only impressions?” For an international company, the question may be “Did growth come from the target market, or from countries outside the commercial service area?”
A well-designed report creates three benefits:
- Faster diagnosis: filters can narrow a trend by landing page, country, device, query type, directory, or brand status.
- Better prioritization: teams can compare visibility with business value instead of chasing every ranking movement.
- Clearer accountability: the report can connect a technical fix or content release to the metric it was intended to influence.
Separate leading indicators from business outcomes
SEO work often affects several stages of the journey. Indexable pages, impressions, and rankings are earlier indicators. Clicks, engaged visits, leads, transactions, and revenue are closer to commercial outcomes. None is inherently “the” SEO KPI. The right choice depends on the objective and the reliability of the available data.
For example, a new service page may initially have no meaningful conversions. Its first useful signals could be indexed coverage, impressions for relevant queries, and clicks from the intended country. A mature product category may need a stronger commercial view involving organic revenue, conversion rate, margin, and inventory availability. Putting both pages under one scorecard labeled “SEO success” hides the different stages of evaluation.
An illustrative reporting policy might define the following:
- Technical work: monitor indexed URLs, affected templates, crawl or coverage observations, and organic impressions.
- Content work: monitor relevant query groups, clicks, click-through rate, landing-page engagement, and assisted conversions where attribution is available.
- Commercial work: monitor qualified leads, transactions, revenue, or pipeline value, while documenting attribution settings.
These are starting policies, not universal benchmarks. A business with long sales cycles should not reject useful SEO work because a lead has not converted within the same reporting month. Conversely, a retailer should not treat impressions as sufficient evidence when product pages are receiving traffic but failing to generate transactions.
Use context instead of decorative dashboards
Charts do not explain causality. Add annotations for a site migration, algorithm-related volatility, a major content release, a tracking change, a discontinued product line, or a seasonal promotion. Keep the annotation factual and dated. “Organic conversions fell because rankings dropped” is an unsupported conclusion unless the data demonstrates that relationship. “Organic conversions fell on 12 May 2026; non-brand clicks were stable, while checkout tracking changed on the same date” is a testable observation.
For page titles, descriptions, and search snippets, teams can also pair report analysis with a practical meta description length checker. For internal content planning, a internal link opportunity tool can help turn pages with existing visibility into a structured linking plan. Neither tool replaces analysis, but both can support actions that the report identifies.
How Looker Studio reporting works in practice
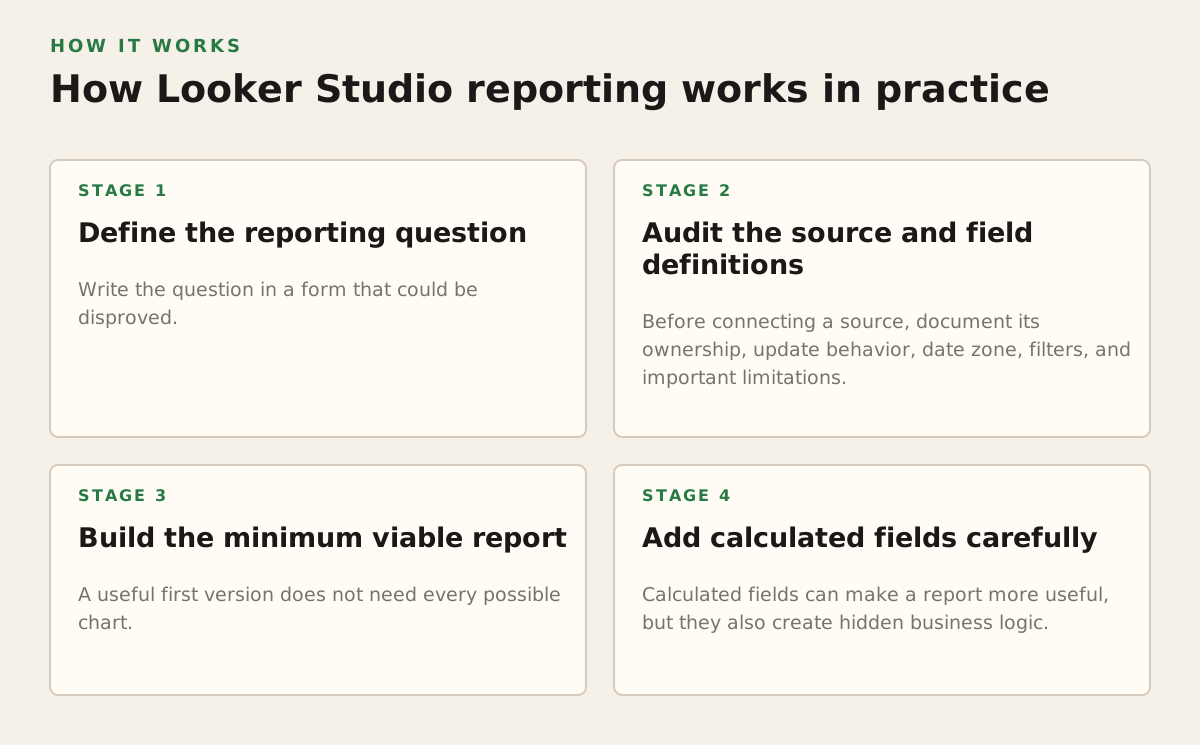
The workflow begins before anyone chooses a chart. Start with a question, identify the source that can answer it, define the required dimensions and metrics, and only then design the page. This order is important because a visual cannot recover data that was never collected or a distinction that the source does not preserve.
1. Define the reporting question
Write the question in a form that could be disproved. “How is SEO doing?” is too broad. “Did non-brand organic clicks to Bangladesh service pages fall after the 2026 navigation change?” is specific enough to investigate. “Which product categories gained organic revenue during the Eid campaign?” identifies both a segment and a commercial outcome.
Useful questions usually contain four elements:
- Population: which pages, queries, users, products, or markets?
- Time frame: compared with what prior period or event?
- Metric: impressions, clicks, sessions, leads, revenue, or another defined measure?
- Action: what decision will change if the result is positive or negative?
2. Audit the source and field definitions
Before connecting a source, document its ownership, update behavior, date zone, filters, and important limitations. Google’s connector documentation explains that connectors provide access to data sources and that configuration can affect what is available in a report (Google’s data source documentation). The practical implication is that a connector is not a guarantee that two platforms will use identical definitions or refresh at identical times.
Create a small data dictionary. It might state that:
- “Organic search sessions” means Analytics sessions attributed to the selected organic search channel under the current channel grouping.
- “Search clicks” means clicks reported by Search Console for the selected property and date range.
- “Brand query” is defined by a maintained list of brand terms, including spelling variations and product names.
- “Qualified lead” means a form submission that passes the agreed validation rule in the CRM, not every form event.
If a metric cannot be explained in one or two sentences, it is not ready for an executive scorecard. This is especially important when a marketing agency reports across clients: the same label may conceal different filters, conversion definitions, or property scopes.
3. Build the minimum viable report
A useful first version does not need every possible chart. A practical SEO report can begin with:
- A summary page showing the selected period, comparison period, clicks, impressions, click-through rate, and the agreed business outcome.
- A landing-page table showing pages, clicks, impressions, click-through rate, and conversions or revenue where measurement is reliable.
- A query or topic view showing search demand and page alignment, without pretending that every query is available at every level of detail.
- A technical or coverage page connecting known implementation issues to affected URL groups.
- An action log recording the observation, owner, recommendation, date, and expected signal.
Use filters that reflect real decisions: country, device, brand status, directory, page type, product category, or service area. Avoid adding a filter merely because the source provides the field. Every control creates another way for users to misunderstand the report.
4. Add calculated fields carefully
Calculated fields can make a report more useful, but they also create hidden business logic. A rate should have a defined numerator and denominator. For example, click-through rate is not interchangeable with conversion rate. A blended “SEO opportunity score” may be convenient, but it becomes difficult to audit if its weights are undocumented.
Keep formulas close to the decision they support. A page-level view might use a simple classification such as:
- High impressions, low clicks: investigate intent alignment, snippet appeal, competition, and search-result features.
- Clicks, low engagement: investigate landing-page relevance, speed, message match, and tracking quality.
- Engagement, low conversion: investigate offer, trust signals, form friction, price, stock, or lead qualification.
- Low impressions and valid indexing: investigate demand, internal links, content depth, authority, and competition.
These classifications are prompts for investigation, not automatic diagnoses. A low click-through rate can be reasonable for a query where a search feature answers the question directly. A low conversion rate can reflect poor traffic quality, an unsuitable offer, or an incorrectly configured event.
5. Validate before sharing
Validation should happen at the source, report, and business levels. Compare a small sample of dashboard values with the source interface or an export. Check that the selected property, date range, filters, and currency are correct. Then ask a business owner whether the reported outcome corresponds to the records they recognize.
For Analytics implementations, the reporting API and data model have their own dimensions, metrics, and compatibility rules. Google’s Analytics Data API documentation is a useful reference when verifying what a requested report can represent (Google Analytics Data API documentation). Do not solve an incompatible or ambiguous metric by creating a more elaborate chart. Fix the definition first.
Where dashboards break and how to diagnose them
The most dangerous reporting failures are not obvious errors. They are plausible numbers that answer a different question from the one stakeholders think they are seeing.
Source mismatch and attribution drift
Search Console may show a different trend from Analytics because the systems measure different events and apply different processing. Search Console records search performance; Analytics records activity after the site receives a visitor. A comparison can still be useful, but it must be framed as a diagnostic relationship rather than a one-to-one reconciliation.
Attribution can also change the apparent value of organic traffic. A conversion may be credited according to a selected model, reporting identity, lookback window, or channel rule. Record these settings in the report and date any material implementation change. If the definition changes, preserve the old period’s context rather than presenting a false uninterrupted trend.
Sampling, thresholds, and unavailable detail
Some platforms restrict, aggregate, or omit detail. Search queries may not reconcile perfectly with totals when low-volume queries are not exposed. A page or query table may contain only part of the activity represented by a summary number. Treat the summary as the summary and the detailed table as a diagnostic sample unless the source documentation supports a stronger interpretation.
Never fill a data gap with a confident narrative. Label a view as incomplete, remove it, or change the question. “No visible queries” does not always mean “no searches occurred.” It may mean the selected property, date range, dimension, or reporting threshold does not support the requested detail.
Blending and join problems
Blending can appear to solve the problem of combining Search Console, Analytics, and business data, but the join key determines whether the result is meaningful. A URL can vary by protocol, trailing slash, case, parameters, locale path, or canonicalization. A product ID may be absent from the landing-page URL. A country label can differ between systems.
Before blending, define:
- Join key: the exact field used to match records.
- Grain: whether each row represents a page, query-page pair, product, session, or day.
- Cardinality: whether one record matches one, many, or no records in the other source.
- Fallback: what happens when the key is missing or malformed.
If the grain is different, totals can inflate. For example, joining one daily revenue row to several query-page rows can repeat the same revenue multiple times. This is not a cosmetic issue; it changes the business conclusion. When the relationship is too complex for a dependable blend, use a prepared warehouse table, a controlled spreadsheet export, or separate views with a clearly stated relationship.
Time zones, currencies, and comparison periods
A monthly comparison can be misleading when one source uses a different reporting time zone or when the business changed its currency presentation. Make the report’s time zone, currency, and comparison logic visible. For international companies, separate market performance from currency movement. Revenue growth in local currency may not equal growth after conversion, and neither measure should be shown without its unit.
Seasonality also requires restraint. Comparing a promotional week with an ordinary week may answer a tactical question but not establish a durable SEO trend. Use event labels and compare like-for-like periods where the business question requires it.
Dashboard overload and false precision
A page with dozens of scorecards encourages users to hunt for a favorable number. Keep the number of primary decisions small. A report should make it obvious which movement requires investigation, which action is recommended, and what evidence would change that recommendation.
Use ranges, annotations, and plain-language caveats when the data is uncertain. A calculated score of 83.4 can look more precise than the underlying measurement deserves. Precision in formatting is not precision in knowledge.
How SEO practitioners should apply Looker Studio
The strongest use of Looker Studio is not producing a prettier monthly PDF. It is creating a repeatable operating rhythm in which data leads to a bounded investigation and a documented action.
For technical SEO
Build views around URL groups rather than only sitewide totals. Segment by template, directory, status, language, device, or market. When rankings or clicks fall, compare the affected group with a control group that was not exposed to the same change. Review deployment dates, redirects, canonical tags, robots directives, internal links, rendering behavior, and indexation evidence outside the dashboard when necessary.
A technical report should answer:
- Which URL group changed?
- When did the change begin?
- Which search markets and devices were affected?
- Was the change limited to visibility, clicks, engagement, or conversion?
- What implementation event could plausibly align with the timing?
Do not label a chart “Google penalty” merely because traffic declined. A penalty, algorithmic change, technical incident, demand change, and tracking failure require different evidence and different responses.
For content strategy
Use page and query data to find mismatches between what a page is visible for and what the business wants it to attract. A service page receiving impressions for informational questions may need clearer intent alignment. A blog post receiving commercial queries may need a relevant internal link to a service or category page. A product category with impressions but weak clicks may need better title and description testing, stronger differentiation, or improved page experience.
Group pages by intent and role, not just by URL. An editorial guide, comparison page, category page, and location page should not share identical success criteria. Add a content action field such as “refresh,” “consolidate,” “create supporting page,” “improve internal links,” or “leave unchanged.” The report should show why that action is appropriate.
For local and international SEO
Separate markets before interpreting growth. For a Bangladesh-focused business, a country filter can show whether visibility is concentrated in the intended market. For an international company, add language and location dimensions where the data supports them, then verify that localized URLs, currency, contact details, and conversion paths correspond to the selected market.
Local reporting should connect organic visibility with the actions that matter to the business. Depending on the measurement setup, that may include calls, appointment requests, direction requests, store visits, or qualified contact forms. Do not combine all locations into one average if one branch has a tracking problem or a very different service area.
For agencies and white-label reporting
Agencies should standardize the structure while allowing client-specific definitions. A reusable template can include a summary, acquisition view, landing-page analysis, technical notes, content opportunities, and action log. But the KPI definitions, conversion events, brand terms, market filters, and business commentary must be configured per client.
Before sending a report, use a handoff checklist:
- Confirm the client property and reporting period.
- Verify that the comparison period is appropriate for seasonality and campaigns.
- Check whether source data has refreshed and whether any connector failed.
- Review major movements against deployments, promotions, outages, and tracking changes.
- Remove charts that do not support a current decision.
- Write three to five prioritized actions with owners and evidence.
The action log is especially valuable for penalty recovery or ranking loss. Record the suspected issue, evidence, confidence level, remediation, validation method, and date. This prevents teams from repeatedly proposing the same generic fixes without learning whether the previous action changed the relevant signal.
Worked example: diagnosing a commercial-page decline
Consider an illustrative example, not a universal benchmark. A software company sees the following month-over-month movement in its dashboard:
| Segment | Impressions | Clicks | Organic leads | Initial interpretation |
|---|---|---|---|---|
| Brand queries | +12% | +9% | +4% | Demand and navigational traffic increased |
| Non-brand service pages | -18% | -27% | -31% | Commercial visibility weakened |
| Informational articles | +22% | +16% | +2% | Reach grew without equivalent lead growth |
The report should not conclude that “SEO fell” because the overall number is mixed. The next investigation would isolate the service-page directory by country and device, check whether the decline began after a navigation or template release, compare indexed and canonical URL patterns, and inspect whether lead tracking changed. If impressions fell first, visibility or demand is the leading question. If impressions stayed stable but clicks fell, search-result presentation and intent alignment deserve attention. If clicks stayed stable but leads fell, investigate landing-page relevance, form behavior, offer strength, and measurement.
The decision might be to repair a template issue, refresh a set of service pages, or correct lead tracking—not to publish more content automatically. A useful dashboard narrows the next test; it does not pretend to complete the diagnosis.
A practical standard for trustworthy SEO dashboards
Use Looker Studio when it reduces repeated manual work and makes a consequential decision easier to see. Do not use it to disguise weak measurement, reconcile incompatible systems by force, or produce activity theater for a monthly meeting.
Before delivery, ask whether the report meets these standards:
- Traceable: every important metric has a named source and definition.
- Segmented: brand, non-brand, market, device, page type, and business units are separated when the decision requires it.
- Comparable: date ranges, time zones, currencies, filters, and attribution settings are documented.
- Actionable: each major observation leads to an owner, investigation, test, or explicit decision not to act.
- Honest: gaps, thresholds, sampling, join limitations, and tracking changes are visible.
- Maintainable: a named person can update definitions, replace a source, and explain the report without relying on its original builder.
For a small or medium-sized business, start with one decision-focused report rather than a sprawling executive portal. For an e-commerce brand, prioritize category, product, revenue, and inventory context. For a local business, prioritize location and qualified action data. For an international company, prioritize market integrity and localized conversion paths. For an agency, prioritize repeatable definitions and a disciplined approval process.
My recommendation for 2026 is to treat Looker Studio as the visible layer of an SEO measurement system: define the question, document the data, segment the evidence, annotate important events, and connect every meaningful chart to a decision. If your team needs help turning fragmented search data into an auditable reporting and SEO action plan, Mr Haq can support the strategy, implementation, and ongoing interpretation.
Authored with NotFair SEO