


A useful local seo report shows whether nearby customers can find a business, whether they take meaningful actions, and what the team should change next. Build it around decisions—not a wall of charts—by separating visibility, website visits, and leads; documenting how each metric is defined and refreshed; then assigning every signal to an owner who can act on it.
This guide is for small businesses reviewing one location, multi-location teams comparing branches, e-commerce brands with local landing pages, and agencies reporting to clients. The right report depends on what counts as a valuable local action for that business. A phone-button click, for example, is not proof that a call connected or became a sale.
1. Start with the decision and the reporting boundary
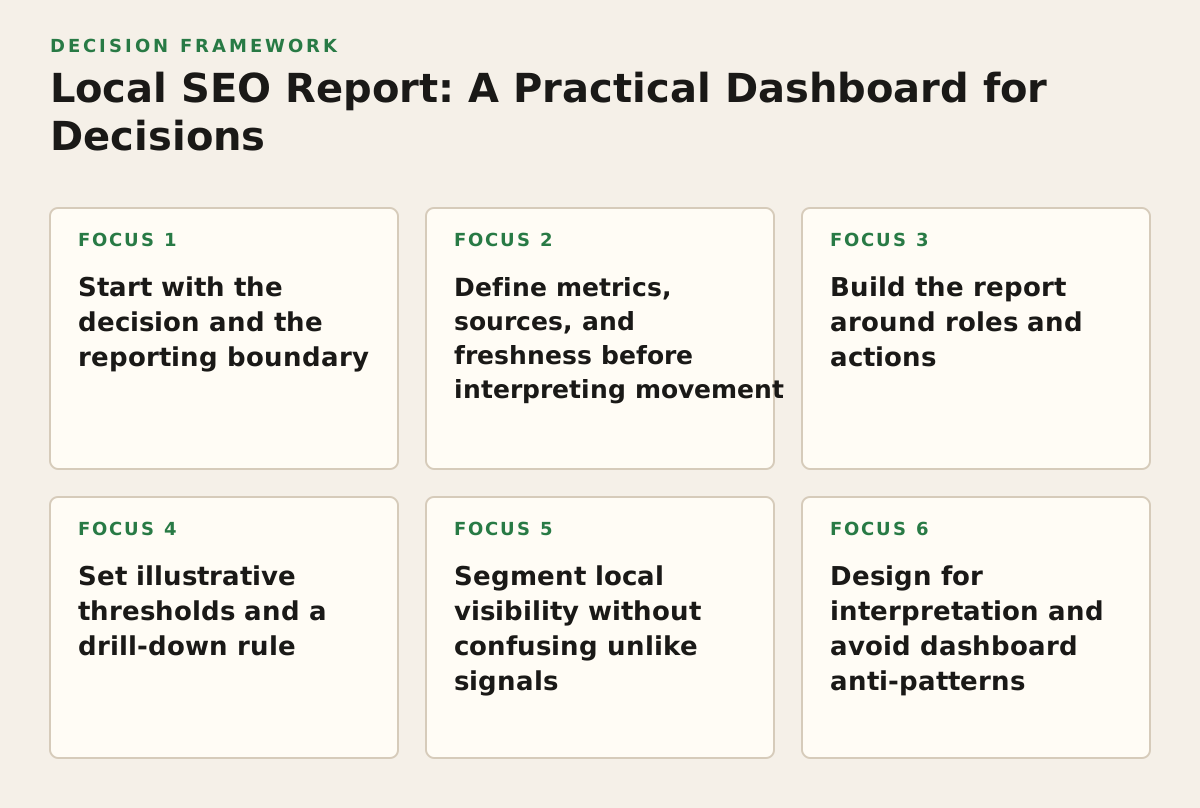
Choose the decision before the chart. An owner may need to know whether to fix a location page, investigate a drop in calls, or ask a branch manager to update business information. An SEO lead may need to distinguish a search visibility change from a conversion problem. Those are different questions and need different views.
Set the boundary explicitly. Record which locations, markets, services, landing pages, and reporting period are included. If a company serves several cities, decide whether its report covers each real location, service areas, or both. Do not treat a city page as evidence that the business has a staffed location there.
Write a one-line reporting brief
Before building a dashboard, complete this sentence: “If [signal] changes for [scope], [owner] will [action].” For example: “If non-brand clicks to the repair page fall for the North location, the SEO lead will check query coverage and page changes before requesting a content update.”
- One location: Report that location’s profile, relevant landing pages, and meaningful contact or lead actions.
- Several branches: Give leaders a comparable summary, then let local owners inspect their own location.
- International markets: Separate market, language, and location where the data supports it; do not combine unlike search environments into one unexplained total.
- Agency reporting: Agree on scope, metric definitions, and who approves changes with the client before presenting results.
Failure mode: A report that mixes every city, service, and page can hide a branch-level problem behind growth elsewhere. If one location loses visibility while another gains it, a single total may appear unchanged. Keep a portfolio view for prioritization, but preserve the drill-down to the affected location and page.
2. Define metrics, sources, and freshness before interpreting movement
Give every metric a definition. “Leads” could mean submitted forms, tracked calls, booked appointments, or qualified opportunities. Pick the event that matches the business’s process, document what it includes, and label weaker proxies honestly. A call-button click is a click; unless the business can verify connection and outcome, do not report it as a completed lead.
Use each platform for the question its data can answer. Google Business Profile Performance reports interactions and other profile-related performance measures; the exact available measures depend on the profile and report. Google’s documentation for Business Profile performance is a useful reference when defining what a profile metric represents. Search Console reports search performance such as clicks, impressions, and queries for a property; it is not a record of completed sales. See Google’s Performance report documentation. For site visits and configured events, use analytics reporting and state the attribution or event definition being used; Google describes the GA4 Traffic acquisition report as a view of traffic by acquisition dimensions.
Put freshness beside the number
Source data can arrive on different schedules, so a dashboard’s refresh time is not necessarily the same as the latest date represented in every chart. Record the source, its latest available date, the dashboard refresh time, and the reporting window. Looker Studio’s documentation explains that data freshness depends on the data source and its freshness settings; check those settings rather than assuming every connector updates together.
Failure mode: Comparing a complete period in one source with a partially populated period in another creates a false trend. If a report mixes an up-to-date profile view with delayed analytics data, label the lag and hold the conclusion until the periods align. Do not “correct” the discrepancy by inventing a blended total.
Keep a short metric dictionary with the dashboard or its supporting notes:
- Metric and definition: What is counted, and what is excluded?
- Source and scope: Which property, profile, location, event, or page set is included?
- Freshness: What is the latest complete date, and how often is the source expected to update?
- Owner and action: Who checks an unusual change, and what is the first investigation?
3. Build the report around roles and actions
Give each role a useful view of the same evidence. A business owner needs a concise explanation of demand and leads. An SEO specialist needs enough detail to locate the cause. A location manager needs a clear task, not a chart of search queries they cannot change. A reusable role-based structure prevents the dashboard from becoming a dumping ground for every available metric.
| Role | Question and signal | Drill-down | Action owner |
|---|---|---|---|
| Business owner | Are local enquiries moving with relevant visibility? | Location, service, landing page, and lead type | Owner or marketing lead decides where to investigate or allocate work |
| SEO lead | Which search segment or page changed? | Brand versus non-brand queries, page, location, and period | SEO lead checks indexing, content, competition, and tracking |
| Location manager | Are profile interactions or site contacts changing for this branch? | That location’s profile and relevant contact paths | Manager verifies operational details and reports issues |
| Analyst or agency | Is the change real, comparable, and attributable? | Source freshness, definitions, filters, and event setup | Analyst validates data before a recommendation is issued |
Keep a summary-to-diagnosis path: a decision-focused landing view, a location or market comparison, then the page/query or conversion detail needed to investigate. For example, a decline in one branch’s enquiries should lead to that branch’s landing pages and tracked contact events, not directly to a sitewide content rewrite.
Failure mode: One dashboard page for every audience usually satisfies none of them. Executives are forced to interpret technical charts; specialists lack filters; local staff cannot tell what to do. Use role-based pages or clearly separated sections, while keeping definitions consistent across them.
4. Set illustrative thresholds and a drill-down rule
Use thresholds as investigation prompts, not universal benchmarks. A threshold should account for the business’s normal variation, data volume, seasonality, and decision cost. Start with a clearly labeled policy, review it after observing normal reporting cycles, and record when it changes. A small local business may need a different alert rule from a large brand with many locations.
For example, an illustrative starting policy might flag a location when its completed lead measure falls for two comparable reporting periods, or when a key landing page loses visibility while the wider site remains stable. These are examples of alert design, not industry standards. Choose a comparison window that matches the business’s sales cycle and verify that the latest data is complete before escalating.
Use a fixed investigation sequence
- Validate the signal: Check date range, source freshness, filters, tracking changes, and whether the comparison uses like-for-like periods.
- Find the affected segment: Split by location, page, service, and brand/non-brand query where available.
- Locate the break: Determine whether the change is in visibility, visits, or the step from visit to contact.
- Assign one next check: For example, inspect an affected page’s indexability or verify the location’s contact details.
- Log the outcome: Record the finding, owner, action, and a date to review whether the signal changes.
Failure mode: Alerting on every small fluctuation trains people to ignore the report. If a line moves but the data is incomplete or the volume is too small to interpret, mark it for review instead of presenting it as a confirmed loss. A threshold is useful only when it changes what someone does.
5. Segment local visibility without confusing unlike signals
Separate profile activity from website search performance. A business profile interaction and an organic click to a location page describe different steps in discovery. Keep them in separate measures, then relate them carefully to the business outcome. Do not add them together as if they were unique people; the same person may interact through more than one path.
Segment by the units the team can act on: location, service, landing page, market, or query group. Use brand and non-brand query groups where the available data supports a meaningful distinction. Branded searches can reflect existing awareness; non-brand searches can help reveal whether relevant discovery is changing. Neither category alone proves that a customer is nearby or ready to buy.
Failure mode: A “local visibility” score that combines map interactions, organic impressions, and site sessions conceals what changed and may double-count activity. Keep source measures distinct, define any composite score transparently, and use it only when its weighting and intended decision are understood.
Structured data can be a useful technical diagnostic, but it is not a substitute for measuring visibility or leads. Google’s LocalBusiness structured data documentation describes how to provide business details in a structured format; treat implementation checks as a site-quality task, not proof that local performance improved.
6. Design for interpretation and avoid dashboard anti-patterns
Make the next action visible next to the signal. A chart should identify its scope, comparison period, source, freshness, and owner. Add a short note when a known event—such as a tracking change or a page migration—affects interpretation. Use consistent labels for locations and pages so the person investigating does not need to decode internal naming conventions.
Common anti-patterns include:
- Vanity totals without context: An increase in impressions says little if the report does not show which locations, pages, or query groups drove it.
- Mixed definitions: Calling clicks, calls, and form submissions “leads” hides important differences in intent and verification.
- Unmarked stale data: A polished chart can look current even when a source is delayed.
- Too many visualizations: Repeated charts make it harder to spot the few signals tied to an actual decision.
- Unowned alerts: A red indicator without a named reviewer and next step is decoration, not a control.
Use the smallest set of charts that answers the reporting brief. A location comparison might show a relevant visibility measure alongside a defined lead measure, with a click-through to the pages and events behind the change. If a chart cannot be connected to a decision or investigation, remove it or place it in a clearly labeled reference view.
For landing-page work, keep the report connected to the task without overstating what a tool can do. When reviewing snippets, the site’s meta description length checker can support a title-and-description editing workflow; for page discovery, the internal link opportunity tool may be relevant when checking internal-link opportunities. Treat either as a supporting resource, not evidence that a page ranks or converts.
7. Implement, validate, and govern the reporting loop
A report is working only if it changes a decision or confirms that no change is needed. Validate it against a real review: choose a signal, ask the assigned owner to investigate, and record whether the report made the cause and next step clearer. If people repeatedly export data to rebuild the same view, or disagree about what a metric means, fix the report’s definitions and drill-down before adding more charts.
- Agree on scope: List the locations, markets, pages, services, and business outcomes included. Name exclusions.
- Write the metric dictionary: Define each signal, source, attribution or event rule, and known limitation.
- Assign ownership: Name a data steward to check source and definition changes, an analyst or SEO lead to validate anomalies, and a business owner for operational follow-up.
- Set freshness expectations: Show the latest complete date and dashboard refresh information; note any source lag that affects comparison.
- Build the role-based views: Start with the owner summary, then add the specialist drill-down and location-level task view.
- Run a validation review: Follow one real change from signal to investigation to action. Record what the report changed, what it missed, and who will adjust it.
- Review governance: Revisit definitions, filters, thresholds, and ownership when tracking or business operations change—not just when the dashboard looks untidy.
Keep a simple decision log with the date, signal, validation performed, action, owner, and later outcome. If a flagged decline repeatedly turns out to be delayed data, adjust the freshness check; if a meaningful page problem is never visible, improve the drill-down. That feedback loop makes reporting more reliable without rewarding dashboard complexity.
If your team needs help shaping local SEO measurement, content priorities, or analytics reporting, Mr Haq provides SEO strategy and consulting across these areas. Explore Mr Haq’s SEO consulting to discuss the reporting decisions your business needs to make.
Authored with NotFair SEO