


Choosing looker studio templates is not mainly a design decision. It is a reporting decision: which business questions should the dashboard answer, which data can support those answers, and which actions should happen after a metric changes? For an e-commerce brand, that may mean connecting non-brand organic traffic to product revenue. For a local business in Bangladesh, it may mean separating map visibility, calls, direction requests, and location-page performance. This guide helps business owners, agencies, and SEO teams select or build a reporting system that is useful after the first presentation—not merely attractive in a screenshot.
A template can save setup time, but it cannot repair inconsistent tracking, unclear definitions, missing access, or an SEO strategy without priorities. Use the framework below to decide what the report must explain, which source should be authoritative, and how the report will trigger a decision.
1. Start with the reporting job, not the template gallery
Apply this principle before opening a template marketplace or duplicating a community report. The right starting point is the recurring meeting, client question, or recovery problem the dashboard must support. A marketing agency serving several clients may need a reusable executive view. An international company may need country and language segmentation. A business recovering from a ranking loss needs diagnosis, not a cheerful traffic scorecard.
This works because a dashboard is an interface for decisions. If the decision is “which category should receive SEO resources next month?”, a page showing total sessions is insufficient. If the decision is “did our technical fix improve crawlable pages?”, revenue alone is too distant from the mechanism. Define the question, the owner, the time horizon, and the action before choosing charts.
Write a one-page reporting brief
- Audience: owner, marketing lead, SEO specialist, agency account manager, or board-level stakeholder.
- Primary decision: the action the user should be able to approve, reject, or investigate.
- Scope: domain, country, property, business line, device, or campaign.
- Cadence: weekly diagnosis, monthly performance review, or quarterly planning.
- Required sources: Search Console, Analytics, advertising platforms, CRM, product feed, rank tracker, or spreadsheet.
- Non-goals: metrics that look interesting but will not change a decision.
Failure mode: selecting a general “SEO dashboard” and then forcing every client into its layout. That usually creates a page of disconnected scorecards, with no explanation of whether a change came from demand, rankings, tracking, site availability, or conversion quality.
Implementation example: An agency supporting a Dhaka-based medical clinic writes this brief: “Every month, decide which service and location pages deserve content, internal-linking, or technical work.” The report therefore needs branded versus non-branded queries, clicks by service page, country and city signals where available, landing-page conversions, and a page-level action log. A social-media acquisition page is excluded unless it helps explain assisted demand or conversion quality.
A useful test is: if this number changes, who does what by when? If nobody can answer, the metric belongs in a diagnostic appendix—or nowhere.
2. Match every metric to a trustworthy source and definition
Use this principle when a report combines data from several platforms. Similar labels do not mean identical measurements. Search Console records Google Search performance, while Analytics records activity measured on a website or app. Their clicks, sessions, dates, attribution rules, and filters should not be treated as interchangeable.
Google describes the Search Console Performance report as a view of Search traffic and lets users analyze dimensions such as queries, pages, countries, and devices; its official documentation is the appropriate reference when defining that dataset (Google Search Central: Performance report). Google Analytics documentation separately explains traffic acquisition dimensions and session-scoped attribution, so an SEO dashboard should label Analytics metrics according to their own definitions rather than rename them “Google clicks” (Google Analytics Help: traffic-source dimensions).
Create a metric contract
- Metric name: for example, Search Console clicks or Analytics organic sessions.
- Source: exact property, account, view, connector, or export.
- Scope: user, session, event, page, query, or date.
- Filters: country, device, brand classification, hostname, landing page, or channel.
- Comparison: previous period, year over year, or a fixed baseline.
- Owner: the person responsible for investigating unusual movement.
Failure mode: placing Search Console clicks beside Analytics organic sessions and calling the difference a tracking error. The numbers can diverge for valid reasons, including different processing, date handling, consent behavior, attribution, and measurement scope. The report should explain the relationship, not promise equality.
Implementation example: Label one scorecard “Search Console clicks” and another “Analytics organic sessions.” Add a note stating that the first measures Google Search activity and the second measures recorded site sessions attributed to the organic channel under the selected Analytics settings. Use the same date range and property scope, then investigate large changes with landing pages, country, device, and annotation notes.
For GA4 implementations, define conversions using the event model rather than assuming every form submission, purchase, or phone click is automatically comparable. Google’s official Analytics documentation explains how key events are configured and reported, which makes it a safer implementation reference than copying a field name from an unrelated dashboard (Google Analytics Help: key events).
3. Build the executive page around outcomes, not vanity totals
Apply this category for owners, directors, and clients who need a fast monthly view. The page should answer three questions: what changed, why it changed, and what should happen next. It should not attempt to expose every available dimension.
This works because senior stakeholders have limited review time and usually fund outcomes rather than isolated visibility. An executive page can still include SEO indicators, but it should connect them to commercial or operational results. For e-commerce, that may be organic revenue, transactions, conversion rate, and priority-category demand. For lead generation, it may be qualified leads, calls, booked consultations, and the landing pages producing them.
A practical executive layout
- Outcome row: revenue, qualified leads, purchases, or another agreed business result.
- Acquisition row: organic sessions, Search Console clicks, or non-brand clicks.
- Visibility row: impressions, average position, indexed priority URLs, or a carefully defined rank-tracking measure.
- Change narrative: three annotated movements with an owner and next action.
- Risk block: tracking gaps, product-feed issues, major technical errors, or landing-page weaknesses.
Failure mode: making total clicks the headline KPI for every business. Clicks can rise while qualified leads fall if search demand shifts toward informational queries, the wrong country is included, or the landing page fails to convert. Conversely, clicks can be flat while revenue improves because high-value product or service queries perform better.
Implementation example: For a Bangladesh-focused online retailer, show organic revenue and transactions by product category at the top, then non-brand Search Console clicks for those categories. Add a table of the five largest month-over-month changes, with columns for URL, query group, clicks change, conversion change, likely cause, and assigned action. Keep all-site traffic available on a secondary page so the executive view stays decision-focused.
4. Use diagnostic pages to separate demand, visibility, and conversion problems
Use this principle when rankings or revenue move unexpectedly, or when a client asks why traffic is “down.” A diagnosis needs a chain of evidence. The useful sequence is usually demand → visibility → click behavior → landing-page experience → conversion.
Search Console can show query, page, country, and device breakdowns, while Analytics can show behavior and conversions after users arrive. That combination is valuable precisely because neither source explains the complete journey alone. Google’s Search Console documentation describes filtering and grouping performance data by dimensions such as query and page (Google Search Central: Performance report), while Google’s Analytics documentation explains acquisition reporting for traffic arriving at the site (Google Analytics Help: traffic-source dimensions).
Build four diagnostic views
- Demand view: impressions, query groups, seasonality notes, and country or language segments.
- Visibility view: clicks, impressions, average position, indexed priority URLs, and affected page types.
- Click-quality view: landing pages, device split, title and snippet changes, and brand versus non-brand segments.
- Conversion view: key events, revenue or lead value, assisted paths where reliable, and page-level conversion rate.
Failure mode: diagnosing a ranking loss from an all-site average position. A site can gain visibility for low-value queries while losing important commercial queries. Averages also conceal query mix, country mix, and page-level differences.
Implementation example: An international software company sees organic sessions falling in Singapore but not Bangladesh. The diagnostic page filters Search Console by country, compares impressions and clicks for commercial query groups, then checks Analytics landing pages and demo key events for the same period. If impressions declined, investigate demand, eligibility, or visibility. If clicks held but demos fell, inspect page changes, form events, consent behavior, and lead-quality handling before changing SEO content.
For a penalty or broad ranking-loss investigation, add a dated annotation log: deployment, migration, template change, robots modification, algorithm-related communication, manual-action review, and tracking release. Do not label correlation as causation. The report should preserve competing explanations until page-level evidence rules them out.
5. Treat connectors, fields, and freshness as implementation constraints
Apply this principle before promising a client a polished automated dashboard. A template is only as useful as the data connection behind it. Looker Studio’s official help explains that reports use data sources and connectors to access data, and that credentials and ownership affect how viewers can access connected information (Looker Studio Help: data sources and connectors). Confirm access and governance before adapting the visual layer.
This works because many reporting failures are operational rather than analytical. A dashboard may load for its creator but fail for a client, show stale data, lose a calculated field after a source change, or combine properties that should remain separate. A reliable template makes assumptions visible.
Run a pre-build access and freshness check
- Confirm ownership or authorized access for every source.
- Record the property, account, view, website, currency, timezone, and country scope.
- Check whether historical data is available for the comparison period.
- List fields used in calculated metrics and filters.
- Test what a client or white-label agency user can see.
- Document refresh expectations and the person responsible for failures.
Failure mode: copying a template first and discovering later that a required connector, custom field, or account permission is unavailable. Replacing the missing field with a similarly named metric can silently change the meaning of the report.
Implementation example: Before duplicating a multi-market SEO report, create a source register with one row per market. Record Search Console property, Analytics property, currency, timezone, conversion definitions, and authorized user. Build one market first, validate filters and calculated fields, then duplicate only after the source register and QA checklist are complete.
Use a visible “data last checked” note and a small exceptions table. If an Analytics source stopped receiving purchase events, the dashboard should display that limitation instead of presenting a clean zero. A blank, warning, or “not available” state is more honest than a misleading trend line.
6. Choose visual components according to the decision they support
Use this category when several templates appear equally attractive. Select a chart by the question it answers, not by the space it fills. A time series is for movement; a table is for prioritization; a scorecard is for a small number of agreed headline values; a breakdown is for locating concentration or change.
Component rules for SEO reporting
- Scorecards: reserve for headline outcomes and a clearly defined comparison.
- Time series: use for trend, seasonality, releases, and annotated events.
- Tables: use when someone must choose URLs, queries, products, or locations to act on.
- Scatter or comparison views: use to find pages with impressions but weak clicks, or traffic but weak conversion.
- Filters: include only dimensions that map to a real decision, such as market, device, page type, or brand status.
Failure mode: using a gauge or traffic-light color to imply a universal pass/fail threshold. SEO performance depends on business model, market, season, margins, query intent, and baseline. A red color without a documented policy encourages arbitrary action.
Implementation example: To prioritize category pages, use a table with page, non-brand impressions, clicks, average position, organic revenue, conversion rate, and recommended action. Add a scatter plot with impressions on one axis and click-through rate on the other. Pages with substantial impressions and weak click-through rate may justify snippet or intent work; pages with clicks but weak conversion may require merchandising, trust, speed, or offer work instead.
Keep the visual hierarchy restrained. A template with ten colors and twenty charts can make every movement look urgent. Use one emphasis color for an action, a neutral style for context, and a separate warning style for data quality issues.
7. Add local, e-commerce, and agency layers only when the business needs them
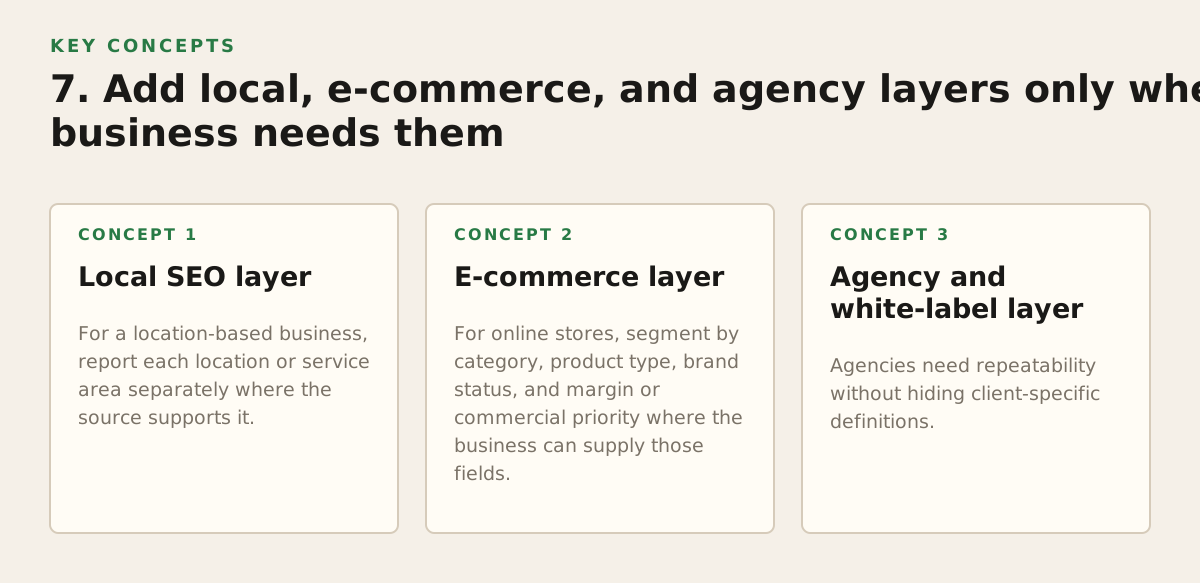
Use specialized pages when the operating model creates a distinct decision. Do not add local SEO, product, paid-media, or agency views simply because the template includes them. Specialized reporting is useful when it reflects the way work is assigned and evaluated.
Local SEO layer
For a location-based business, report each location or service area separately where the source supports it. Useful fields may include landing page, city or country, branded versus non-branded query group, calls, direction requests, appointment key events, review workflow status, and local-page technical issues.
Failure mode: reporting “local rankings” as if one average position represents every searcher. Location, device, personalization, query wording, and tracking methodology can change the result. Treat rank data as directional evidence and pair it with search visibility and business actions.
Implementation example: A clinic with branches in Dhaka and Chattogram uses a location selector, page-level Search Console table, and Analytics key-event table. The monthly action list identifies whether each branch needs a stronger location page, clearer appointment path, internal links, or measurement repair.
E-commerce layer
For online stores, segment by category, product type, brand status, and margin or commercial priority where the business can supply those fields. Separate product detail pages from category pages because they often serve different query intents and require different SEO decisions.
Failure mode: celebrating organic revenue without checking stock, margin, returns, currency, tracking, or product availability. Revenue is an outcome, but it does not explain whether an SEO change created durable demand or merely captured a temporary promotion.
Implementation example: Add a category-priority field from a controlled spreadsheet, then combine it with organic clicks, product views, add-to-cart events, purchases, and revenue. The report can distinguish “high-demand, low-conversion” categories from “low-visibility, high-conversion” categories, leading to different work queues.
Agency and white-label layer
Agencies need repeatability without hiding client-specific definitions. Create a standard shell for navigation, source notes, date controls, and action logs, then allow each account to define its own goals, markets, brand rules, and conversion events.
Failure mode: presenting identical KPI labels across clients when one counts form starts and another counts qualified sales. Standardize the structure, not the meaning. Put definitions beside the metric and keep a client-specific data dictionary.
How to select and prioritize a template
Use the following framework when comparing several looker studio templates. Score each candidate against the actual reporting brief. The numbers below are an illustrative starting policy, not a universal benchmark; change the weights when the business model or reporting risk demands it.
| Criterion | Question to ask | Illustrative weight | Evidence before adoption |
|---|---|---|---|
| Decision fit | Does the layout answer the recurring business question? | 25% | Map every major chart to an action or decision. |
| Source fit | Can the required properties and fields connect without substitution? | 20% | Test real sources, permissions, filters, and calculated fields. |
| Metric clarity | Are definitions, scopes, comparisons, and exclusions explicit? | 15% | Review the data dictionary with the account owner. |
| Diagnostic depth | Can a user move from outcome to page, query, market, or event? | 15% | Trace one unexpected change through linked pages and filters. |
| Maintenance cost | Can the team update it when fields, properties, or goals change? | 10% | Document refresh, access, calculated fields, and ownership. |
| Audience usability | Can the intended viewer understand it without a live explanation? | 10% | Ask a non-builder to find the next action using only the report. |
| Brand and accessibility fit | Is it readable, restrained, and suitable for client delivery? | 5% | Review contrast, labels, mobile behavior, and white-label needs. |
Give each criterion a score from one to five, multiply by the illustrative weight, and record the reason. A visually impressive template that fails source fit should not outrank a simpler report that can be maintained. If two options score similarly, choose the one with fewer calculated fields and clearer ownership.
Turn the dashboard into an operating system for SEO work
A report earns its place when it changes the work queue. Add an action register rather than ending every page with a vague note such as “improve SEO.” The register can live in a spreadsheet or project-management system, while the dashboard shows the current status and evidence.
Minimum action-register fields
- Issue or opportunity.
- Evidence link or filtered report view.
- Business impact hypothesis.
- Recommended action.
- Owner and due date.
- Priority and effort.
- Implementation status.
- Validation metric and review date.
Failure mode: treating every metric movement as an action. Some changes are seasonal, tracking-related, or too small to justify intervention. Require an explanation and a validation plan before assigning work.
Implementation example: A product-category report shows impressions rising, clicks flat, and revenue unchanged. Instead of immediately rewriting the page, the team records three hypotheses: search-intent mismatch, weak snippet appeal, or SERP feature displacement. It checks query groups and page eligibility, selects one controlled change, and schedules a review. A separate issue is opened if conversion tracking is incomplete.
For content planning, connect the report to an editorial inventory. Pages with high impressions but weak engagement may need intent clarification; pages with strong conversion but low visibility may deserve internal links, authority development, or better category targeting. Before changing titles and descriptions at scale, use a meta description length checker to check that proposed snippets are concise and technically valid; treat length as a review aid, not a guarantee of how Google will display the result.
For site architecture, use page-level evidence to identify relevant relationships rather than adding links indiscriminately. A internal link opportunity tool can help surface potential internal-link opportunities, but a human should confirm topical relevance, anchor clarity, destination quality, and whether the link improves navigation.
Implementation plan: build, validate, and roll out in sequence
Follow this sequence when creating or adapting a report for an SEO client, internal team, or white-label account. The order reduces the risk of polishing a dashboard that cannot answer the intended question.
- Write the reporting brief. Name the audience, recurring decision, scope, cadence, business outcome, and non-goals. Obtain approval before selecting a template.
- Create the source register. List each property, account, connector, timezone, currency, market, permission, refresh expectation, and owner. Mark unavailable fields rather than silently replacing them.
- Define the metric contract. Document names, scopes, filters, formulas, comparisons, conversion definitions, and exclusions. Put a short version near the relevant chart.
- Choose the smallest viable template. Prefer a structure that supports the brief and can be maintained. Remove decorative pages, duplicate scorecards, and metrics without an owner.
- Build the executive page. Lead with the agreed outcome, then acquisition and visibility context. Add a concise change narrative and a visible data-quality note.
- Add one diagnostic path. Let the user move from an outcome to market, device, page, query group, product category, or key event. Test the path with a realistic question such as “why did non-brand leads fall in Dhaka?”
- Configure specialist views. Add local, e-commerce, international, technical, or agency pages only where a distinct operating decision exists. Keep definitions specific to that business.
- Run data-quality checks. Compare date ranges, inspect filters, verify conversions, test permissions, look for nulls and duplicated rows, and confirm that currency and timezone are correct.
- Run a decision rehearsal. Give the report to a stakeholder without explaining the answer. Ask them to identify what changed, why it may have changed, and what action they recommend.
- Connect findings to work. Populate the action register with evidence, owner, priority, hypothesis, and validation metric. A dashboard without this handoff is an archive, not an operating tool.
- Review and prune. At the next agreed cadence, remove charts nobody used, revise confusing labels, record source changes, and update the metric contract before adding new data.
For small and medium-sized businesses, start with one reliable executive page and one diagnostic page rather than a sprawling portal. For international organizations, make market and currency scope explicit before comparing results. For agencies, standardize navigation and QA while preserving each client’s definitions. If the reporting system still leaves the team unsure whether a change is a ranking problem, a tracking problem, or a conversion problem, the next investment should be measurement design and SEO analysis—not another visual template.
Mr Haq helps businesses and agencies design practical SEO reporting systems alongside technical SEO, content strategy, local SEO, E-E-A-T, analytics, and AI search optimization work. If you need a report connected to real priorities rather than a collection of attractive charts, Mr Haq can help shape the measurement and action framework.
Authored with NotFair SEO
